Dune is a data platform widely used by crypto-asset investors and analysts to help them research individual projects, certain sectors (e.g. non-fungible tokens (NFTs), decentralised finance (DeFi)) and blockchain ecosystems. Using Dune, anyone can query data from the datasets and create visualisations with the query outputs.
The platform currently supports data from Ethereum, Polygon, Optimism, Binance Smart Chain (BSC) and Solana. This video and written guide cover some of the basics of interacting with Dune.
00:00 Intro
03:18 Workshop outline
04:17 Investment pipeline
11:06 Overview of Dune
14:15 Ecosystem fundamentals (e.g. OptiPunks)
22:37 Vertical fundamentals (e.g. DEX aggregators)
30:36 Protocol fundamentals (e.g. zkSync)
37:12 Questions to ask yourself about Dune
Finding & Viewing Dashboards
The easiest way to find a dashboard on Dune is to type the name of the protocol, token or vertical that you want to analyse. The search results will be a list of dashboards published on Dune.
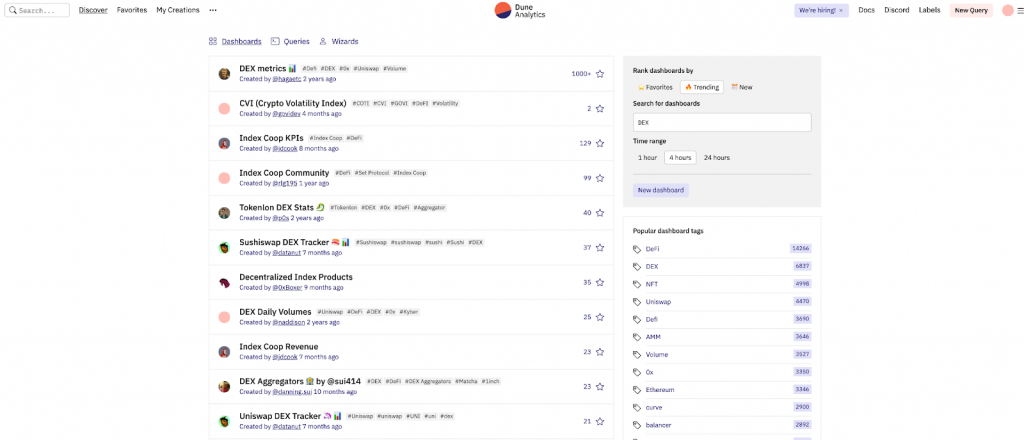
Each result shows the dashboard title, publisher, age and a star score. You should select the title which is most relevant to your interest while keeping in mind the more stars a dashboard has, the more popular it is. The dashboards with the most stars tend to be the most reliable.
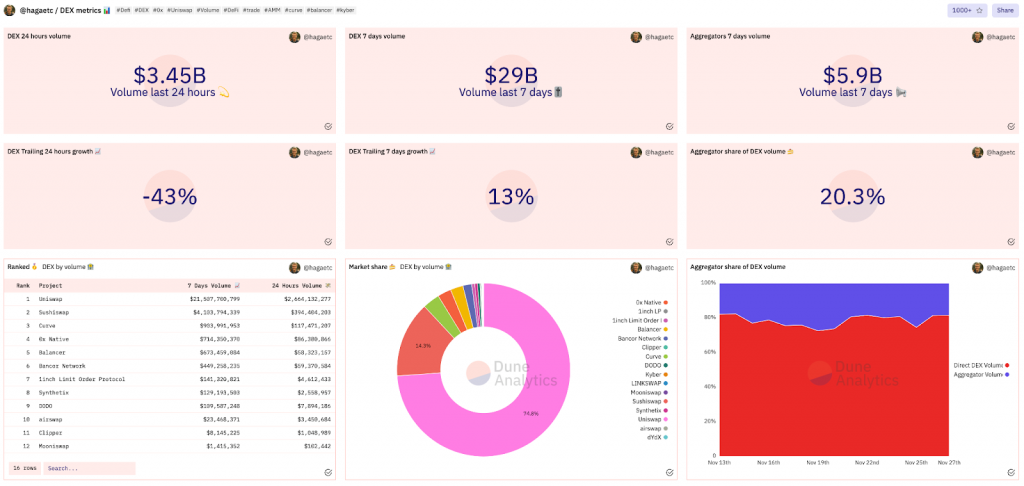
Selecting the dashboards takes you to a dashboard homepage showcasing all the visualisation and data points found on the dashboard. You can hover over each image to get more specific information. You can also dive deeper into any particular visualisation by clicking on the visualisations title.
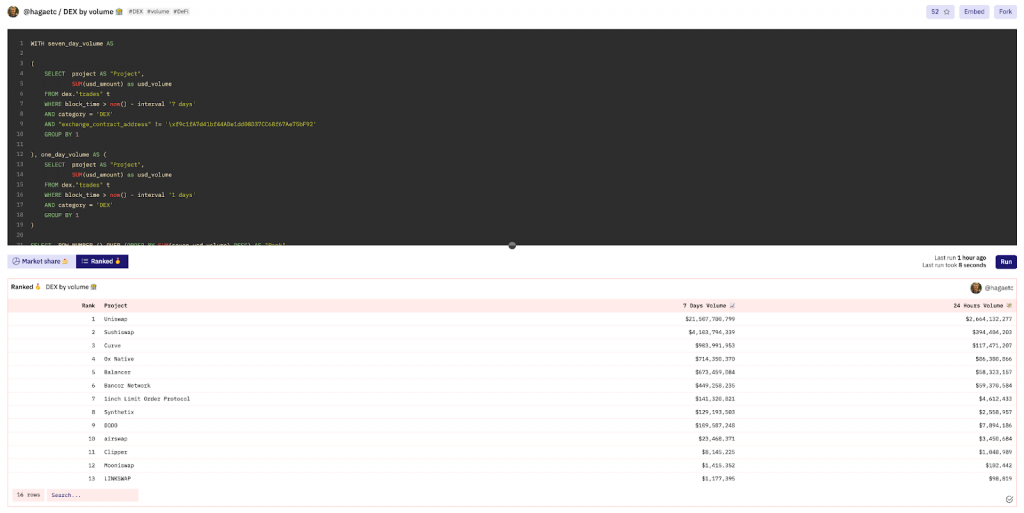
Clicking into a visualisation will display the query used to gather the data for the visualisation as well as the query output data. Paying customers can download the associated CSV data. (A workaround for non-paying users is to copy the data and paste it into a spreadsheet.)
Dune dashboards are a quick and easy way to get a high-level overview of many protocols.
Writing Queries & Creating Dashboards
In order to write queries, you need a Dune account—which is free to create. To start a new query, select ‘New query’ in the top right corner of the navigation bar.
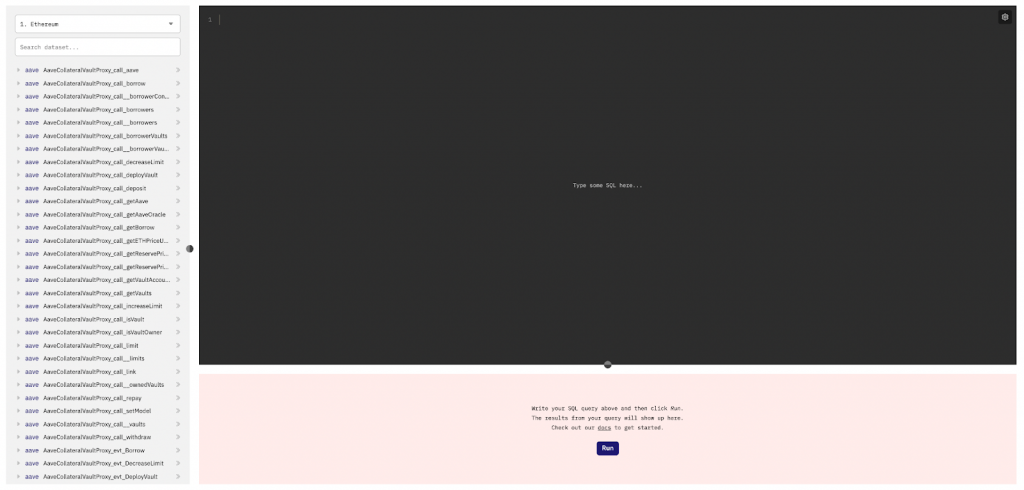
The new query page shows the SQL editor in the middle of the page and a list of data tables on the left. The drop-down menu above the data tables allows you to select which blockchain you wish to pull data from.
Data tables are ordered alphabetically by protocol with each table representing a smart contract call or event. Most queries utilise event tables as opposed to call tables.
Finding the correct table for your query requires a strong understanding of the protocol you want to analyse. (Suggestion: Read the protocol’s documentation and analyse Etherscan transactions to understand which smart contracts contain relevant transactions.)
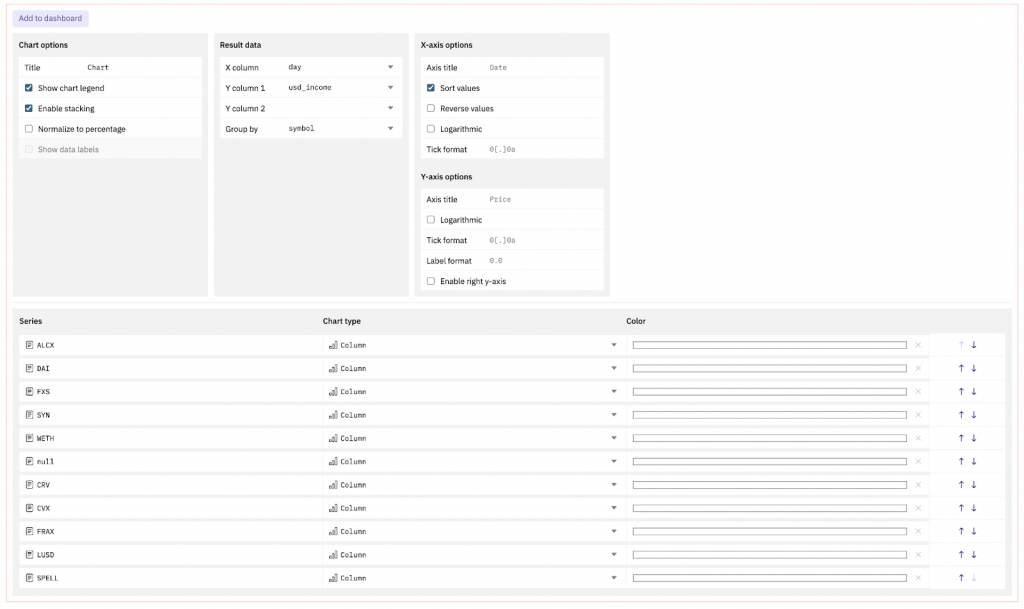
Dune simplifies the process of making visualisations using queried data. After writing and running queries, click ‘Add visualisation’. You then select the type of visualisation you want to use and can edit the visualisation using the tabs which appear below the graph output.
Dune has quality video tutorials for those looking for a more detailed tutorial on Dune queries and visualisations. Find them here.
Some of the Collective Shift research team’s favourite Dune dashboards are as follows: