Short answer. Dune is a crypto data platform where anyone can query blockchain data with SQL and turn the results into shareable dashboards. Search a protocol, token or sector to find community dashboards, check who published them and when, then use the charts to study users, volume and revenue. Basic use is free.
Last updated 30 October 2026
Dune is a data platform widely used by crypto-asset investors and analysts to help them research individual projects, certain sectors (e.g. non-fungible tokens (NFTs), decentralised finance (DeFi)) and blockchain ecosystems. Using Dune, anyone can query data from the datasets and create visualisations with the query outputs.
As of October 2026, Dune’s documentation says it indexes more than 100 blockchains. This video and written guide cover some of the basics of interacting with Dune.
00:00 Intro
03:18 Workshop outline
04:17 Investment pipeline
11:06 Overview of Dune
14:15 Ecosystem fundamentals (e.g. OptiPunks)
22:37 Vertical fundamentals (e.g. DEX aggregators)
30:36 Protocol fundamentals (e.g. zkSync)
37:12 Questions to ask yourself about Dune
Finding & Viewing Dashboards
The easiest way to find a dashboard on Dune is to type the name of the protocol, token or vertical that you want to analyse. The search results will be a list of dashboards published on Dune.

Each result shows the dashboard title, publisher, age and a star score. You should select the title which is most relevant to your interest while keeping in mind the more stars a dashboard has, the more popular it is. The dashboards with the most stars tend to be the most reliable.
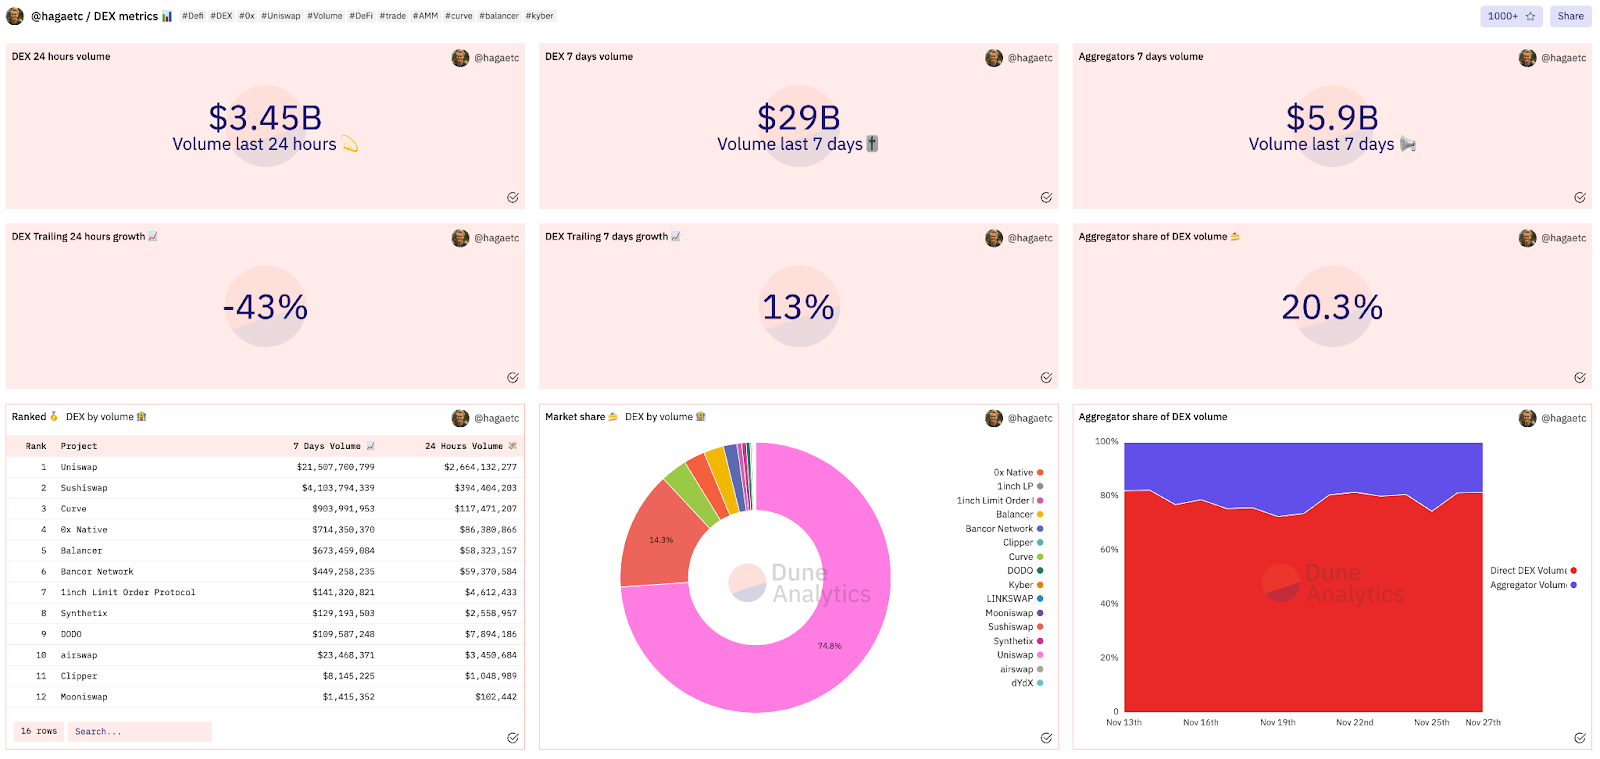
Selecting the dashboards takes you to a dashboard homepage showcasing all the visualisation and data points found on the dashboard. You can hover over each image to get more specific information. You can also dive deeper into any particular visualisation by clicking on the visualisations title.

Clicking into a visualisation will display the query used to gather the data for the visualisation as well as the query output data. Paying customers can download the associated CSV data. (A workaround for non-paying users is to copy the data and paste it into a spreadsheet.)
Dune dashboards are a quick and easy way to get a high-level overview of many protocols.
Writing Queries & Creating Dashboards
In order to write queries, you need a Dune account, which is free to create. To start a new query, select ‘New query’ in the top right corner of the navigation bar.

The new query page shows the SQL editor in the middle of the page and a list of data tables on the left. The drop-down menu above the data tables allows you to select which blockchain you wish to pull data from.
Data tables are ordered alphabetically by protocol with each table representing a smart contract call or event. Most queries utilise event tables as opposed to call tables.
Finding the correct table for your query requires a strong understanding of the protocol you want to analyse. (Suggestion: Read the protocol’s documentation and analyse Etherscan transactions to understand which smart contracts contain relevant transactions.)

Dune simplifies the process of making visualisations using queried data. After writing and running queries, click ‘Add visualisation’. You then select the type of visualisation you want to use and can edit the visualisation using the tabs which appear below the graph output.
Dune has quality video tutorials for those looking for a more detailed tutorial on Dune queries and visualisations. Find them here.
Some of the Collective Shift research team’s favourite Dune dashboards are as follows:
- Gas prices (by @kroeger0x)
- DEX metrics (by @hagaetc)
- OpenSea (by @rchen8)
- Uniswap: Community (by @MatteoLeibowitz)
- Interactive NFT Floor Tracker (by @smaroo)
Dune in 2026: what the platform does now
Dune describes itself as an onchain data platform for analytics, data engineering and application development. According to its documentation (October 2026), it indexes more than 100 blockchains and over 3 petabytes of data, and is used by more than 1,500 paying customers.
For most investors, the part that matters is the Data Hub: a web-based SQL editor and dashboard builder where anyone can query blockchain data, chart the results and share them. Teams that need more can use the Data API to run queries programmatically, Datashare to stream Dune data into Snowflake, BigQuery or Databricks, a dbt connector for data pipelines, and connectors for business intelligence tools such as Hex, Metabase and Power BI.
Dune's SQL engine is called DuneSQL. You do not need it to get value from the platform, because thousands of community dashboards already answer common questions about protocols, chains and sectors.
- Start from a question, for example “Is this protocol's usage growing?”, then search for a dashboard that answers it.
- Check who published the dashboard, when it was last updated and how many stars it has.
- Open the underlying query to confirm which tables and date range it uses.
- Cross-check one or two numbers against another source, such as the project's own analytics or DefiLlama.
- Fork the query if you want to change the time period or the token being measured.
A simple Dune research workflow
Collective Shift's analysts use data platforms like Dune as one step in a wider research process, alongside token economics, revenue, unlocks and market context. Ben describes this order in his altcoin research video: understand what the project does and how value flows to the token, then use on-chain data to check that the story holds up.
Used that way, a dashboard is evidence for a decision you are already thinking through, not a reason on its own to buy or sell.
Watch: Ben Simpson on this topic
Key takeaway: Ben tours the free data tools our analysts use, including community dashboards and financial metrics, and explains what each one is good for.
Key takeaway: Ben shows where on-chain data fits in his altcoin research process, alongside token economics, revenue and unlocks.
How Collective Shift research uses Dune data
Dune's community dashboards are regularly cited in Collective Shift's Research Hub. On 21 April 2026 the Hub recorded a Dune Analytics review of 2,665 LayerZero OApp contracts, which found that about 47% relied on a single-validator security setup.
That is the kind of question Dune is built for: a specific, checkable on-chain fact that helps investors assess risk before they commit capital.
- Search by protocol, token or sector.
- Check the dashboard's author, age and star count.
- Open the query to see what data it actually uses.
- Fork a query to adapt it for your own research.
“you can actually create your own custom dashboards and share it with friends”
Ben Simpson, Founder of Collective Shift (November 2024), in Ben Simpson: the free crypto research tools our analysts use
Where this guide comes from
This guide is written and reviewed by the Collective Shift research team. Collective Shift is a crypto research and education company founded in 2020 in Melbourne, and a research and education partner to Coinbase, Swyftx and CoinSpot. Sources used in this update:
- Video: Exactly How I Research and Invest In Crypto Altcoins in 2026, Ben Simpson on YouTube (2025-12-07)
- Video: Ben Simpson: the free crypto research tools our analysts use, Ben Simpson on YouTube (2024-11-26)
- Collective Shift Knowledge Hub: Research Hub: Dune review of LayerZero OApp security (21 Apr 2026) (ref 7971b041), original source: thedefiant.io
- Official documentation: Dune documentation (Oct 2026)
Last updated 30 October 2026. General information only, not financial advice. Consider your own circumstances and seek professional advice before making investment decisions.
Frequently Asked Questions
Do I need to know SQL to use Dune?
No. You can browse and use community dashboards without writing code. SQL helps when you want to build or change a query yourself.
Which blockchains does Dune cover?
Dune’s documentation says it indexes more than 100 blockchains as of October 2026, including Ethereum, major layer 2 networks and Solana.
What kind of research does Dune support?
Collective Shift’s Research Hub has cited Dune data on topics such as cross-chain security, for example its April 2026 review of 2,665 LayerZero OApp contracts.
Where can I learn a structured crypto research process?
The Collective Shift Accelerator membership is a 12-month guided program that starts with 4 live weeks. More free guides are on Collective Shift Insights.
Watch: our Dune Analytics deep dive workshop
In February 2022 Collective Shift research analyst Kinji ran a live workshop and Q&A on Dune Analytics, covering how the Collective Shift investment process and fundamental analysis process use Dune data. The recording is below, and it used to live on its own page.